
Long Island’s population density
The 2020 Census showed that Long Island’s population and density (the population per square mile) increased by 3% since 2010. Over ten years, LI increased from 2,367 population per square mile to 2,443 per square mile.
But here what matters more is arguably the number of people per housing unit – do we have the housing stock to meet our population’s needs? For example, an area with high population might still have a lower density value if there is adequate housing.
This is explored further in nextLI’s latest research project: Rabbing Long Island’s empty storefronts. Over the next several weeks nextLI will analyze data related to the report and included in it.
Using data from the American Community Survey’s 5-year detailed tables, we calculated the population density by housing unit instead of land area.
While the average number of people per housing unit on Long Island is 2.7, it can be as high as 4.97 per unit. Comparatively, the state and national average is 2.31 and 2.35 people per unit respectively.
- Granted, there are some caveats to this analysis that we have to keep in mind:
- People can’t be fractions, a housing unit either has two people in it or three not 2.7 people
- A five-bedroom house and a studio apartment both count as a single housing unit
- Illegal accessory apartments might not be factored in Census data
While those caveats are noteworthy, they do not change the fact that some areas have much higher concentrations of people than housing units – which reveals a housing shortage, affordability concerns or both.
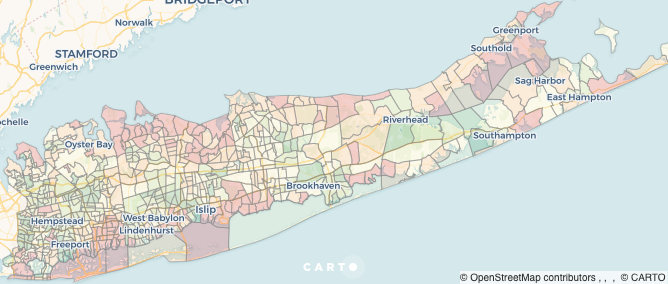
Using the map below, you can explore both the population per housing unit and also the percentage change since 2010.