
Inside Long Island’s 2020 Census results: Diversity Index
When analyzing racial and ethnic diversity, percentage change from two time periods is often used. For example, we might look at the 2010 and 2020 Census and note that the minority population on Long Island has increased by 32.5%.
However, a 32.5% increase does not mean we are 32.5% more likely to meet another person of a different race or ethnic group.
A more helpful data point is possibly the Census’ Diversity Index, an estimate of the probability that two people chosen at random would be from different racial or ethnic groups.
This also means that even if a location might have an increase in a specific minority group, the overall diversity index could drop.
According to the 2020 Decennial Census, the national diversity index currently stands at 61.1%, increased from 54.9% in 2010.
New York State’s 2020 index score is the 8th highest in the nation at 65.8%, a 5.6 percentage point increase from 2010.
The index scores of Nassau and Suffolk counties come in lower than our state index at 63% and 54% respectively, though this still reflects a significant increase from 2010 when Nassau and Suffolk were at 53% and 45%.
However, the index is based on the random selection of two random people. This means that even if Nassau County’s index is 63%, an individual’s personal habits would still influence that percentage.
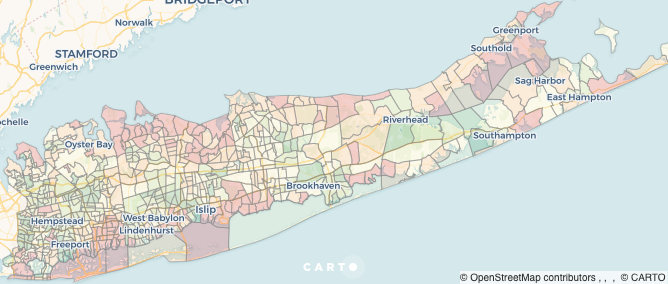
Interested in digging into this data more? Use the map below to explore how Long Island’s diversity index in more detail.